Open-source PostgreSQL monitoring, built the way a DBA works
pgvigil watches your PostgreSQL servers: the daily checks, what is running right now and who is blocking whom, the statements that cost the most, the settings that changed, the jobs that failed, the replication that fell behind. One collector binary, a PostgreSQL repository, a web UI with its own login.
Download the latest release Quick start Source on GitHub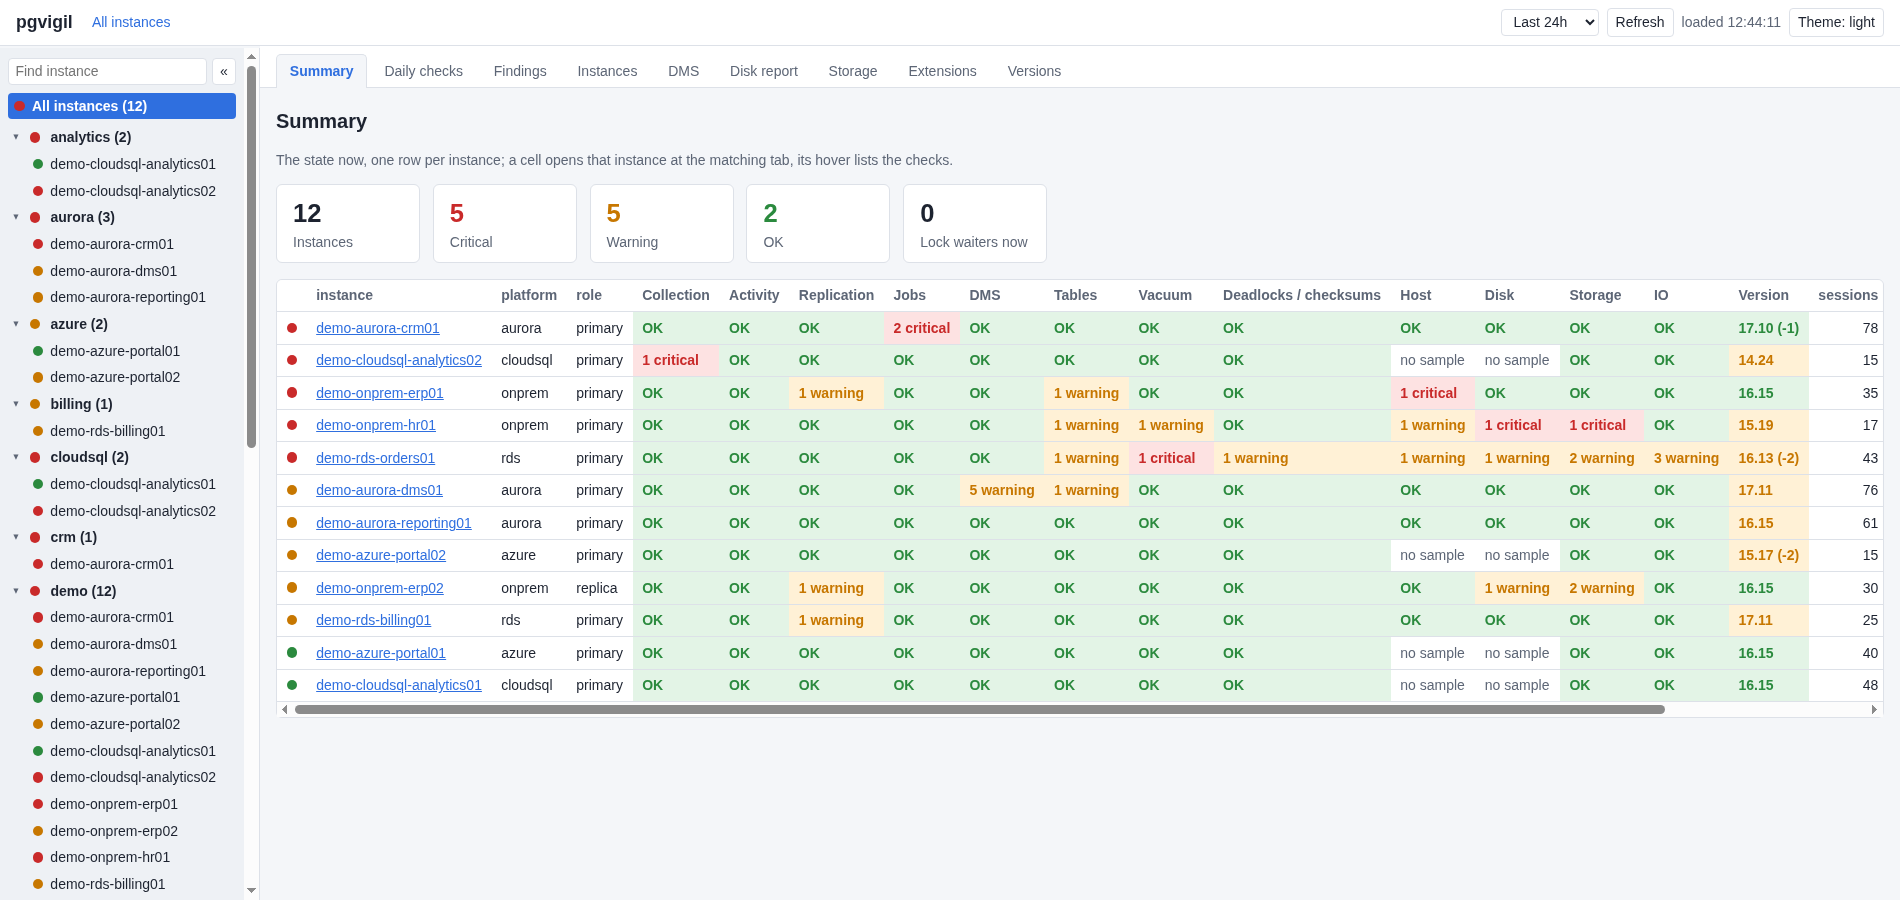
Features
Daily checks
One overview page: stale or failing collections, replication problems, failed jobs, DMS tasks failed or stopped, CDC latency, tables in error, deadlocks and checksum failures in the last 24 hours.
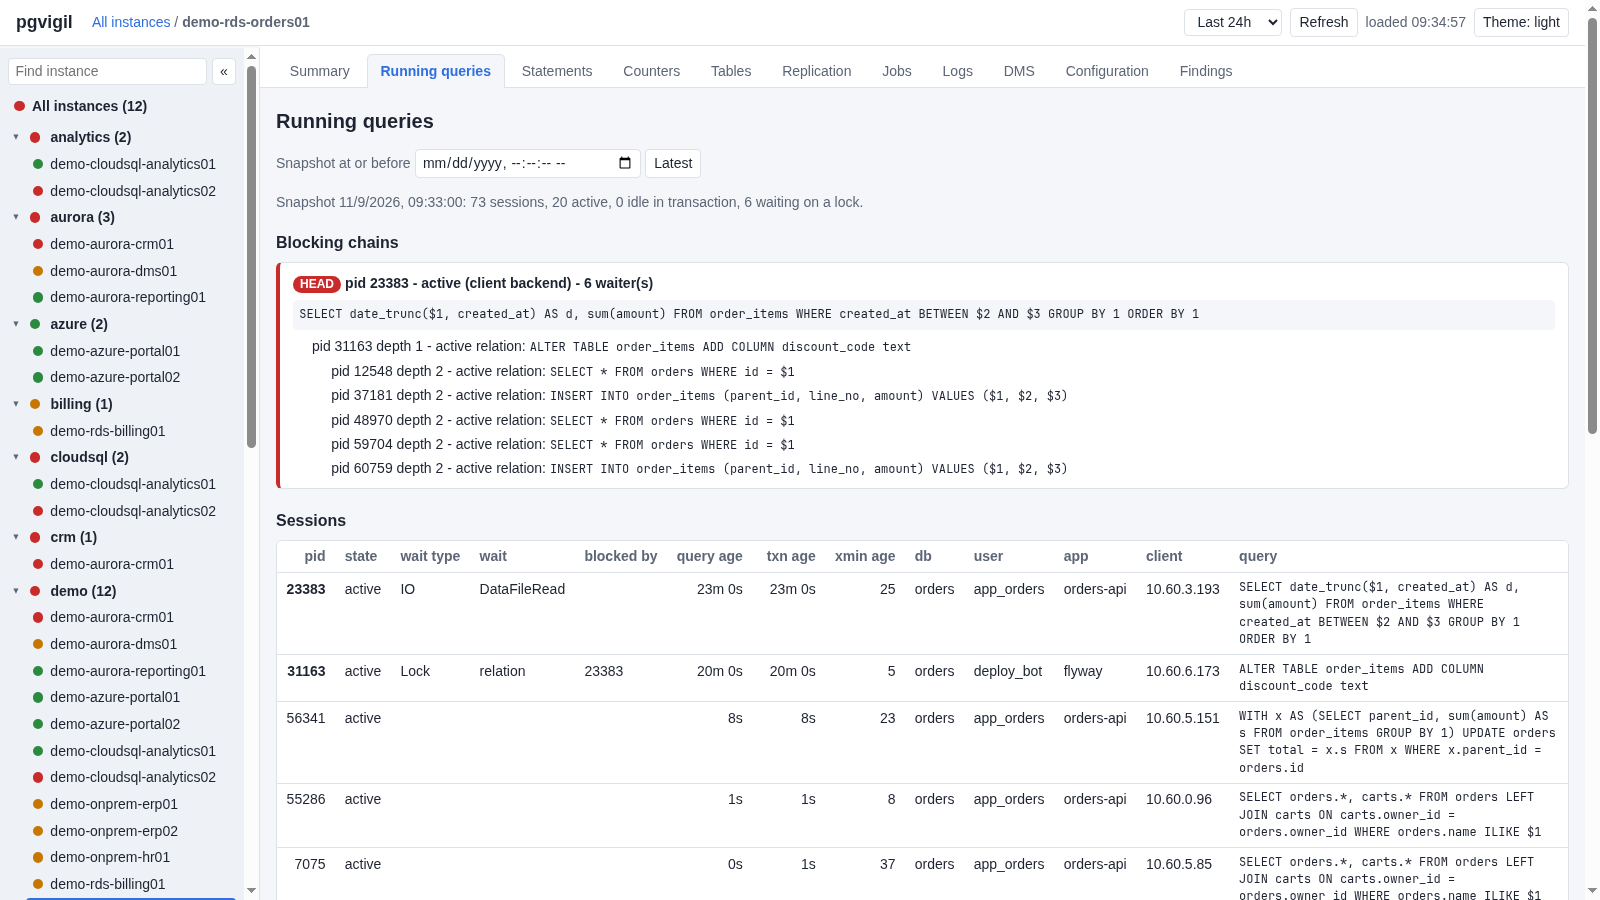
Running queries and blocking chains
Every active and idle-in-transaction session, sampled each minute, with the blocking chain walked to its head. Step back through history by snapshot time.
Top statements
pg_stat_statements as deltas per interval, with reset detection, so the top statements over any window are real numbers, not cumulative totals.
Counters and rates
pg_stat_database, the background writer, checkpointer, WAL and pg_stat_io as rates over a window, charted.
Replication, slots, jobs
Streaming and logical replication, slots with retained WAL, Aurora replica status, pg_cron and pgAgent job runs and failures.
Host, disk and storage
CPU, memory, swap and load from the server itself (system_stats on-prem, CloudWatch on RDS and Aurora), every volume with its free space, growth per day and days until full, a fleet Disk report and a Storage view sorted by the soonest full.
Vacuum, versions, extensions, IO
Running vacuums and the tables autovacuum is behind on, wraparound headroom, every server's version against the PostgreSQL release table with end of life and pending cloud maintenance, outdated extensions, and the storage IO of RDS, Aurora and DMS instances.
Roles, slow queries, job report
Every role with its attributes, memberships and ACLs per database, the hba rules where readable with a change history, and findings such as a superuser beyond the platform's own or a login no hba rule lets in; the slow statements of the server log over any threshold, on-prem through a read door the DBA grants; per job the runs, failures, durations and the next run from the schedule, with failing, missed and over-average jobs across the fleet.
Tags, grouping, actions
Tags as plain words or key:value pairs, the tree grouped by the keys you choose with production first, the Summary filtered and sorted by any tag, an override command so a tag changes without a config deploy; cancel or terminate a session from the UI through a separate login holding pg_signal_backend only, off by default and audited.
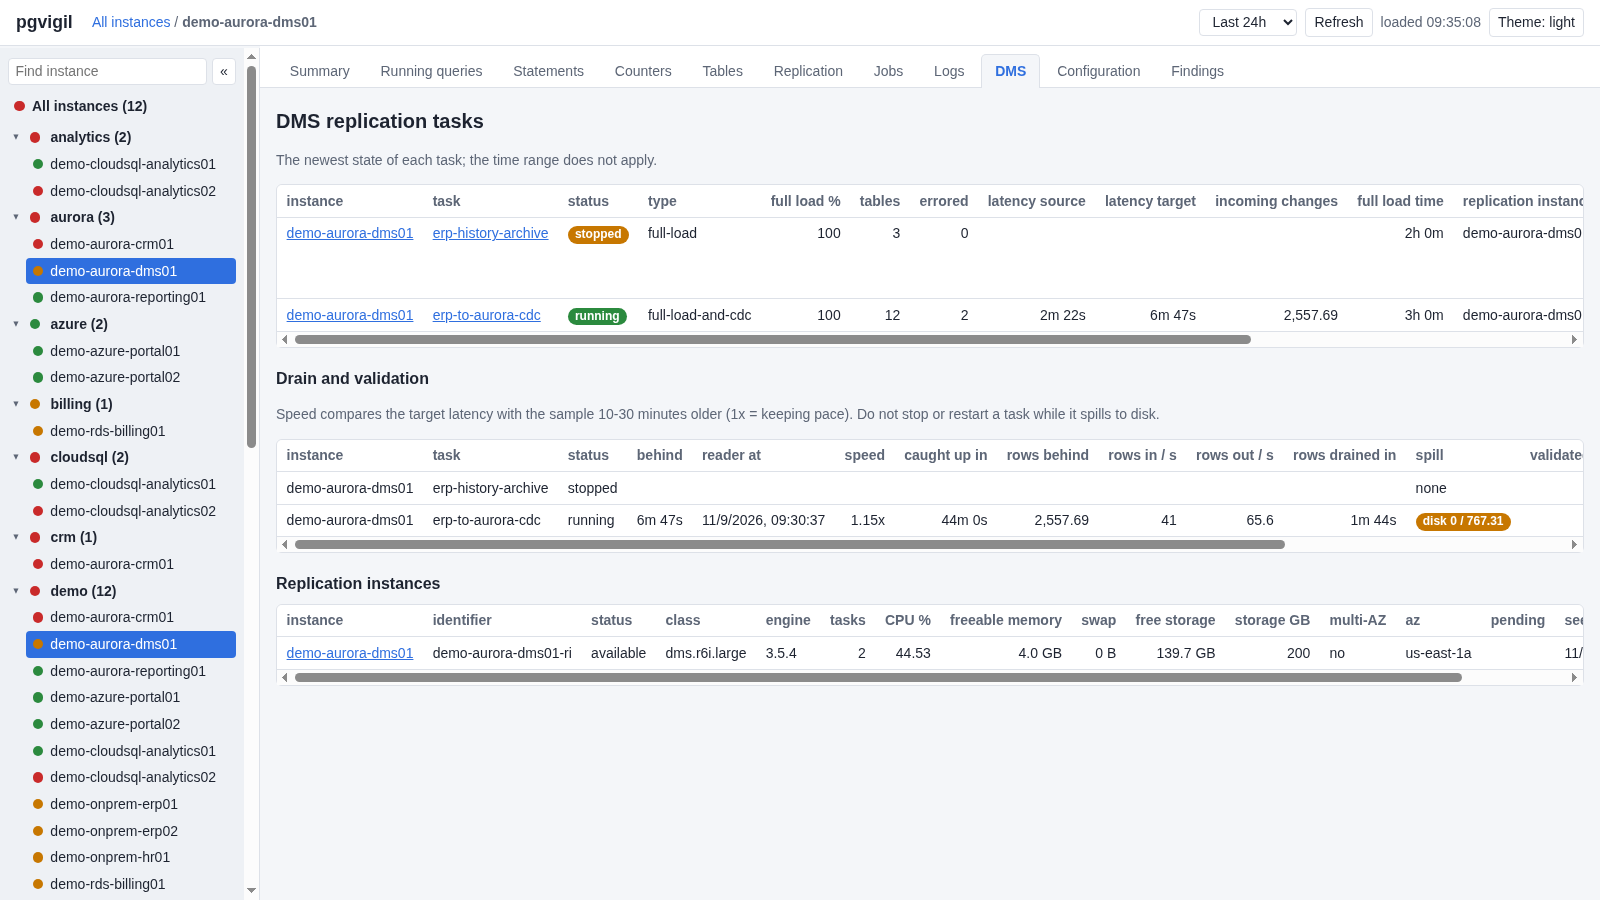
Cloud doors
On RDS and Aurora, the PostgreSQL log from CloudWatch Logs (slow statements, lock waits, deadlocks, failed logins) and AWS DMS tasks with their table statistics and CDC latency.
Every platform, one query set
On-prem PostgreSQL 13 to 18, Amazon RDS and Aurora, Azure Database for PostgreSQL, Google Cloud SQL and AlloyDB. Column names come from the server's own catalog, so one query set serves them all.
Small and static
A single static Go binary for Linux, Windows and macOS, no runtime on the target, about 30 MB of memory while polling fifty instances. The web UI is embedded in the same binary.
Open source, MIT
Built in the open on GitHub. Signed release binaries with checksums; dependencies pinned and scanned in CI.
Government ready
No telemetry and no connection beyond the servers you name and the AWS region you configure (GovCloud included). FIPS 140-3 builds, a CycloneDX SBOM and Sigstore-signed checksums with every release, an air-gapped install procedure, a hardened service unit, and the UI checked against WCAG 2.1 AA.
What it collects
| Collection | Cadence | Source |
|---|---|---|
| instance | hourly | version, recovery state, non-default settings (credentials masked) with a history of changes, extensions |
| activity | 1 min | pg_stat_activity: active and idle-in-transaction sessions, blockers, pg_blocking_pids, blocking chains to the head |
| statements | 5 min | pg_stat_statements, top by time and by calls, per-interval deltas with reset detection; from pg_stat_monitor where pg_stat_statements is absent |
| dbstats | 1 min | pg_stat_database, bgwriter, checkpointer, WAL, as rates |
| iostats | 5 min | pg_stat_io (PG16+) by backend type, object and context, as rates; every minute with schedules: iostats: 1m |
| replication | 1 min | pg_stat_replication, wal receiver, slots with retained WAL, subscriptions, conflicts, aurora_replica_status() |
| databases | hourly | inventory with sizes, transaction id and multixact age |
| jobs | 1 min | pg_cron and pgAgent jobs, run history, failures; the job report: runs, failures and durations over 7 and 30 days, the next run from the schedule, failing, missed and over-average jobs |
| logs | 1 min | RDS and Aurora: the PostgreSQL log from CloudWatch Logs, slow statements, lock waits, deadlocks, failed logins |
| serverlog | 1 min | on-prem: the server-log files through pg_ls_logdir() and a read door the DBA grants (a SECURITY DEFINER function serving only the log files; the wide grant named for what it opens); the same events; the Slow queries view over any threshold |
| dms | 1 min | AWS DMS tasks, table statistics, replication instances, CDC latency, host metrics and the instances' IO, read only |
| tables | hourly | the biggest tables per database with dead rows, bloat, vacuum state and the table checks |
| vacuum | 1 min, tables hourly | vacuums and analyzes running now (a VACUUM waiting on its table lock included), the run history, tables over their autovacuum thresholds for hours, wraparound against the freeze max age, xmin holders |
| host | 1 min | on-prem through the system_stats extension where installed: OS, CPU, memory, load, every mount, device IO; RDS and Aurora through CloudWatch; the fleet Disk report |
| storage | 15 min | volumes with growth per day and days until full, the WAL directory, tablespaces, RDS allocated storage with its autoscaling maximum, the Aurora volume against 128 TiB, database and table growth |
| backups | 5 min | the WAL archiver everywhere (counts, the last archived and failed WAL, the archive lag); on RDS and Aurora the retention, the latest restorable time and the snapshots; pgBackRest and barman are not read |
| corruption, amcheck | from the log; amcheck opt-in | the log reader's corruption classes (page verification failed, invalid page, could not read block, TOAST chunks, xmin before relfrozenxid) from both readers, data_checksums and the two developer settings as findings; amcheck's bt_index_check and verify_heapam where the DBA installed it and granted them, on a schedule the instance names, under a budget |
| plans | 15 min; from the log; on demand | pg_store_plans where installed, every auto_explain line the log readers see, and EXPLAIN without execution from the Plan page; ten plan rules with their reasons (estimates off by 10x, spills, nested loops over a large outer, lossy bitmap scans, heap fetches, JIT, triggers, workers not launched, a CTE scanned twice); pev2 draws the plan; EXPLAIN ANALYZE as an opt-in through its own SELECT-only login, audited |
| extensions | hourly | installed per database against the server's available versions, the preload lists and the extension settings; which servers have which extension |
| versions | hourly | the server version against a built-in PostgreSQL release table (minors behind, end of life), the last restart and version changes, RDS and Aurora upgrade targets and pending maintenance, collation versions |
| io | 5 min | RDS and Aurora storage IO from CloudWatch: IOPS, latency, throughput, queue depth, burst balance; the DMS replication instances' IO |
| roles | hourly | pg_roles (never pg_authid), memberships, database, schema and default ACLs per database, pg_hba_file_rules where readable with a checksum and a change history; findings for superusers, CREATEROLE and BYPASSRLS, the monitoring login, a role on every database, a login no rule lets in |
| waits | 1 min | pg_wait_sampling's profile per event and statement where installed (Azure: pgms_wait_sampling), else the activity samples; the lock tree of the newest snapshot |
| indexes | hourly | unused, redundant, duplicate and invalid indexes per database, each with its DROP and undo line as text; an index advisor on demand where pg_qualstats and HypoPG are installed (hypothetical indexes only, nothing created) |
Install
From v0.2.0, one line installs the collector as a service (the binary is fetched from the release and its checksum verified first; run it again to upgrade):
curl -fsSL https://pgvigil.com/install.sh | sh          # Linux: a system account, a systemd unit
irm https://pgvigil.com/install.ps1 | iex               # Windows: a service under NT SERVICE\pgvigil, elevated PowerShell
No server to point it at yet? pgvigil demo -pgbin <portable PostgreSQL bin folder> -serve -open runs a throwaway repository from an unzipped PostgreSQL, seeds a 12-instance fleet with 7 days of history and serves it on your own machine: no admin rights, no Docker.
By hand, on any release:
- Download the binary for your platform from the latest release and verify it against
SHA256SUMS(signed with Sigstore; the README shows the two commands). - Create a repository database on any PostgreSQL 13+ server and copy
pgvigil.example.yaml; connection strings are read from the environment or a file, never written in the config. pgvigil migrate, thenpgvigil rolesfor the three logins, thenpgvigil user add adminfor the web UI.pgvigil runfor the collector;pgvigil servefor the web UI, over HTTPS withpgvigil certor your own certificate.
pgvigil migrate -config pgvigil.yaml
pgvigil roles                                   # CREATE ROLE statements for the collector, the UI and the monitored servers
pgvigil user add admin -config pgvigil.yaml
pgvigil run -config pgvigil.yaml
pgvigil serve -config pgvigil.yaml -listen 0.0.0.0:8443 -tls-cert pgvigil.crt -tls-key pgvigil.key
The full quick start, the configuration reference and the platform notes are in the README. The installer scripts are deploy/install.sh and deploy/install.ps1 in the repository, served here as the same files; pgvigil install and uninstall are described in the README.
Security
- The collector connects to a monitored server as a
pg_monitorlogin, opens read-only sessions with statement and lock timeouts, and never writes to it. - Credentials never sit in the config file and are masked out of every collected text. A switch stores statement text as is, with every literal replaced, or not at all.
- The repository uses three roles: the collector may only call the import functions, the reader may only read, and the UI's password check runs through one SECURITY DEFINER function nobody else can call.
- The web UI has its own login (argon2id hashes, HttpOnly SameSite=Strict cookies, rate limits) and refuses to listen beyond loopback without TLS.
- Releases are static binaries built by GitHub Actions from a tag, with a SHA256SUMS file signed through Sigstore (a bundle for offline verification included) and a CycloneDX SBOM per target; modules are pinned and checked by govulncheck in CI.
- Government and regulated fleets: FIPS 140-3 builds for Linux and Windows (the Go Cryptographic Module v1.0.0, CMVP certificate #5247), an air-gapped install procedure, a hardened systemd unit (systemd-analyze security 1.4), GovCloud (US) through the region alone, every module's licence in docs/notices.md, and the web UI checked against WCAG 2.1 A/AA in both themes.